User interface design is usually geared towards designing visual artifacts, so it shouldn’t be a surprise to discover most designers think visually. In addition to thinking visually, they “think out loud visually”–they draw sketches. This set of notes serves to indicate that sketching is largely informal, requires no talent, and should be done by everyone in i441. If an assignment calls for sketches, that means draw them by hand and don’t create diagrams on a computer unless a finger or stylus is involved! No PowerPoint, Illustrator, Visio, …
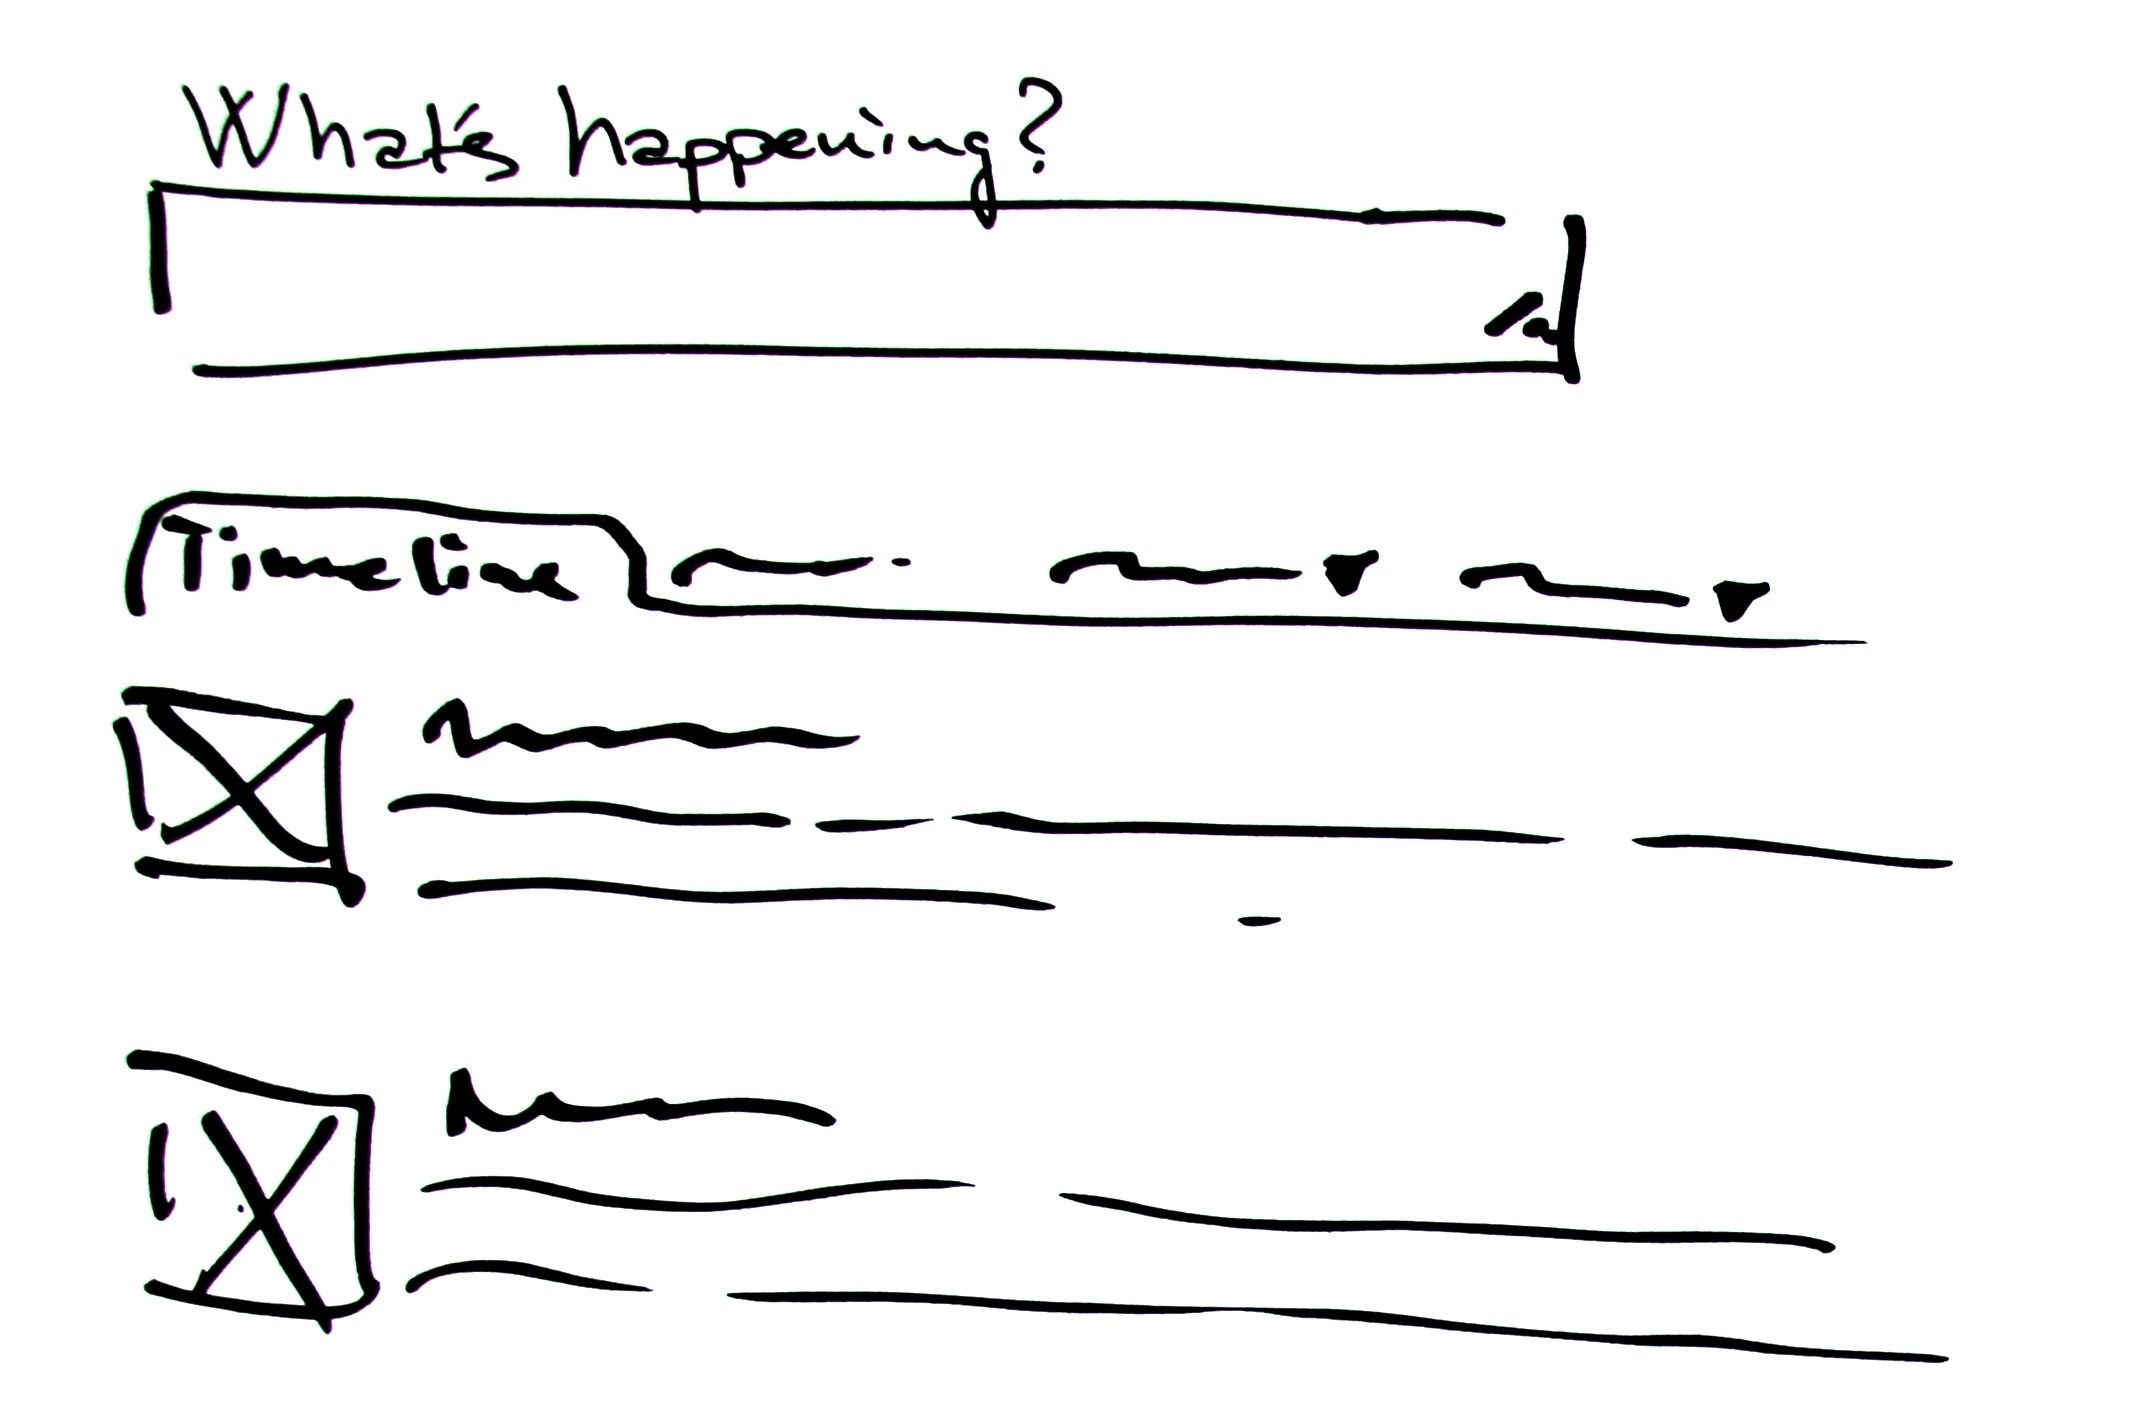
This article from the Interaction Design Foundation gives some good reasons for thinking visually and sketching. It’s quick and informal enough to be “disposable”. If you create fancier, pixel-perfect mockups, stakeholders often assume you’re finished instead of at an intermediate stage awaiting criticism. With informal artifacts, people are more comfortable providing the necessary critical feedback. They also show “scribble sketching” to illustrate just how quick and informal sketching can be:
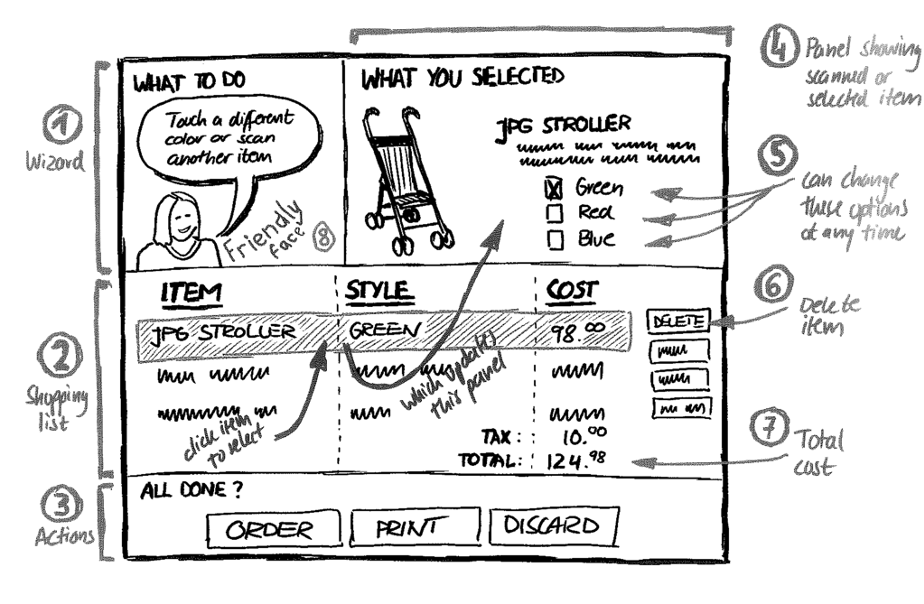
The next few images are from Sketching User Experiences: The Workbook by Greenberg et al. The first thing illustrated is that a picture may be worth 1000 words, but that’s not enough information. Be sure to include annotations to describe what the sketch shows. This is helpful for you to remember your thoughts and critical for other views to understand what the sketch is mean to convey.
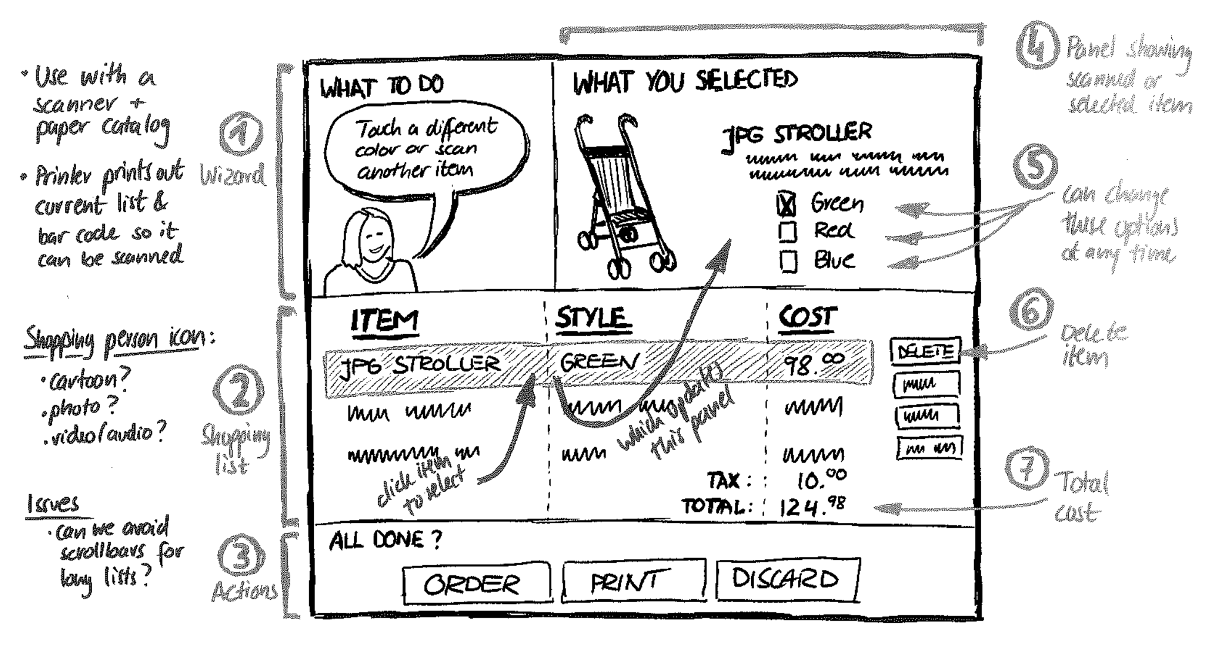
In addition to annotations which provide additional info about specific parts of a sketch, also include notes. Notes are more general than annotations and do not necessarily refer to a specific part of the sketch.
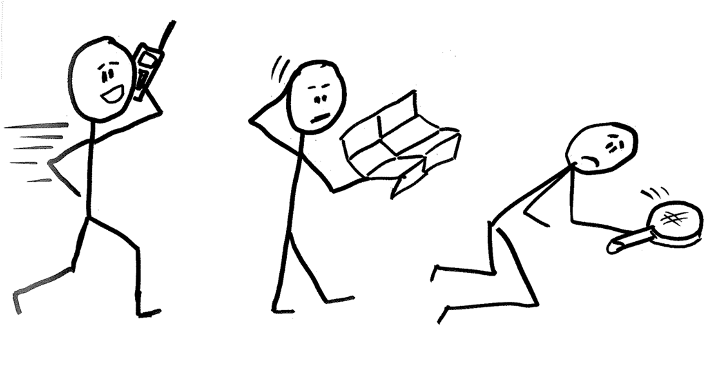
Sketching doesn’t have to just be about the user interface; it should also be about the user. We’ll see that understanding the context of use is critical for successful interaction design, so being able to draw the user in context using a product or accomplishing tasks is important. It’s easy to draw users, even without devoting a lot of time or developing a lot of artistic ability.

State Transition Diagrams
The sketches above were informal, but they can be used throughout a design project to help discover the problem or to help discover the solution. Once the user interface itself is being designed, sketching one screen will not be enough. The connections between screens will have to be considered, too. More generally, a screen is a state of a program, and the state may change in response to user actions or external events. A state transition diagram can illustrate both the states and transitions.
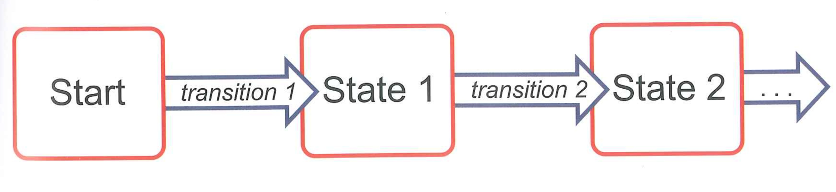
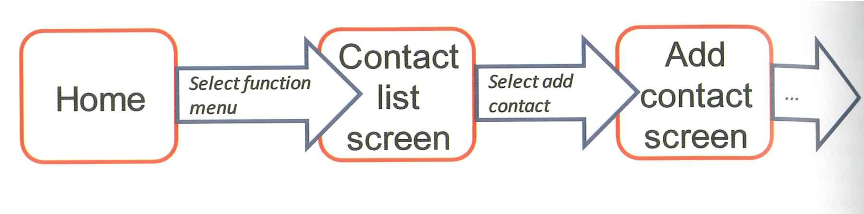
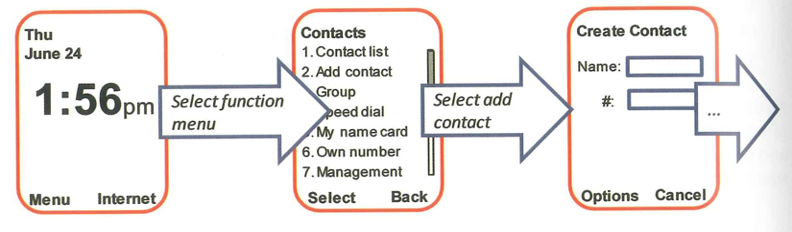
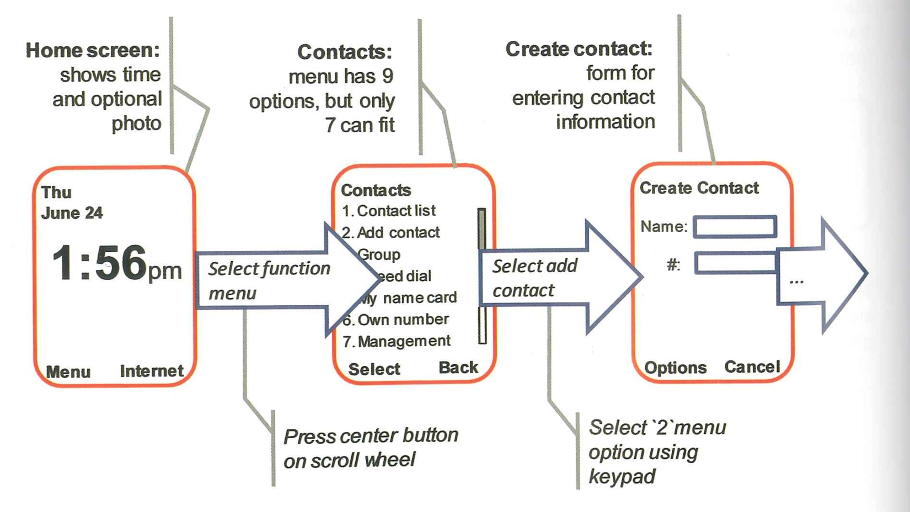
In a state transition diagram, the states are represented as boxes or rectangles. The transitions are represented as arrows. The next 3 figures show 3 state transition diagrams that each represent a sequence of 3 states. The first is just the generic form of any such diagram. The second illustrates one way to indicate the states and transitions: label them by name. The third illustrates a way to convey even more information in the diagram; each box can have a small sketch of the screen in it. This works better for mobile apps or apps intended to run in small windows because sufficient detail can be conveyed in the sketches. For full-screen or large-screen apps, naming each state may be best.
So far I’ve been using states and screens interchangeably, but these diagrams work well in more general contexts, too. For a voice interface as when a user calls an insurance company, these diagrams work, too. Now there is no screen. Each state instead becomes a voice recording or auto-generated speech the user hears.
As with other sketches and diagrammatic methods, the diagrams work best when supplemented with additional notes or annotations.
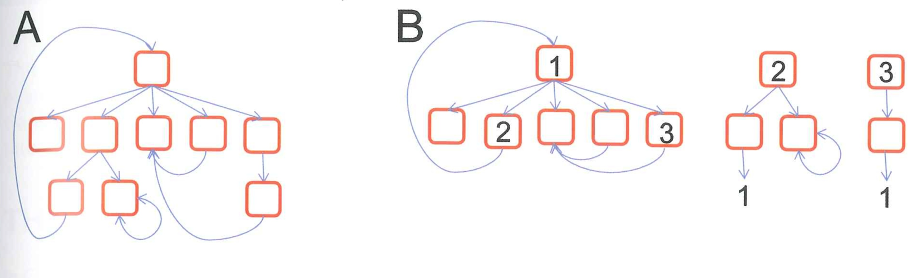
All the state diagrams above show sequences, but in general, apps will have more complex navigations paths through them. Examples are shown below.